

 Elevate your trading game with TradeUI Pro! Enjoy 2 Months when you go yearly!
Succeed as a Trader with Support and Resistance Lines
Support and resistance lines are an important tool for traders, as they can help identify key levels where a stock’s price may struggle to break through or may bounce off of. These levels can be used to make informed trading decisions and potentially maximize profits.
But what exactly are support and resistance lines, and how do they work?
Support lines, also known as floor levels, are price points where a stock’s price tends to find support as it falls. This means that at these levels, the stock’s price may pause or even bounce upward instead of continuing to drop. This can be due to a variety of factors, such as investors seeing value at that price point and deciding to buy, or the presence of a “round number” (such as $50 or $100) that makes it a psychologically significant level for traders.
On the other hand, resistance lines, also known as ceiling levels, are price points where a stock’s price tends to struggle to break through. These levels can act as a barrier, causing the stock’s price to bounce downward instead of continuing to rise. This can be due to a variety of factors, such as the presence of a large number of sell orders at that price point or the stock reaching a level where it is considered overvalued.
So how can traders use support and resistance lines to their advantage? One way is by using them to identify potential entry and exit points for trades. For example, if a stock is approaching a strong support level, it may be a good time to consider buying, as the stock’s price may bounce off that level. On the other hand, if a stock is approaching a strong resistance level, it may be a good time to consider selling, as the stock may struggle to break through that level and head downward.
It’s also important to note that support and resistance lines are not always set in stone. They can change over time, depending on market conditions and other factors. As such, it’s important for traders to continuously monitor these levels and adjust their strategies accordingly.
Here are a few examples of how support and resistance lines can be visualized on a stock chart:
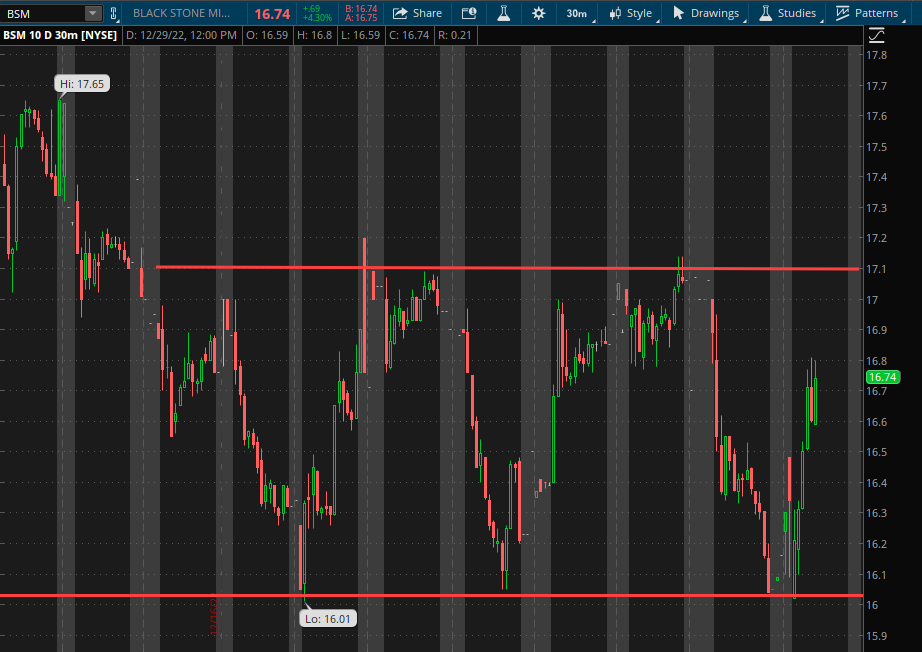
As you can see in the image above, BSM has identified a support line around the $16 dollar price level. Simultaneously, a resistance line has been identified at the $17.10 level. This gives traders/investors a great entry and exit range to capitalize on a consistent stock. Traders that identified this zone would have capitalized on 6.8% multiple times in just 7 trading days!
Lets check out SOFI next.
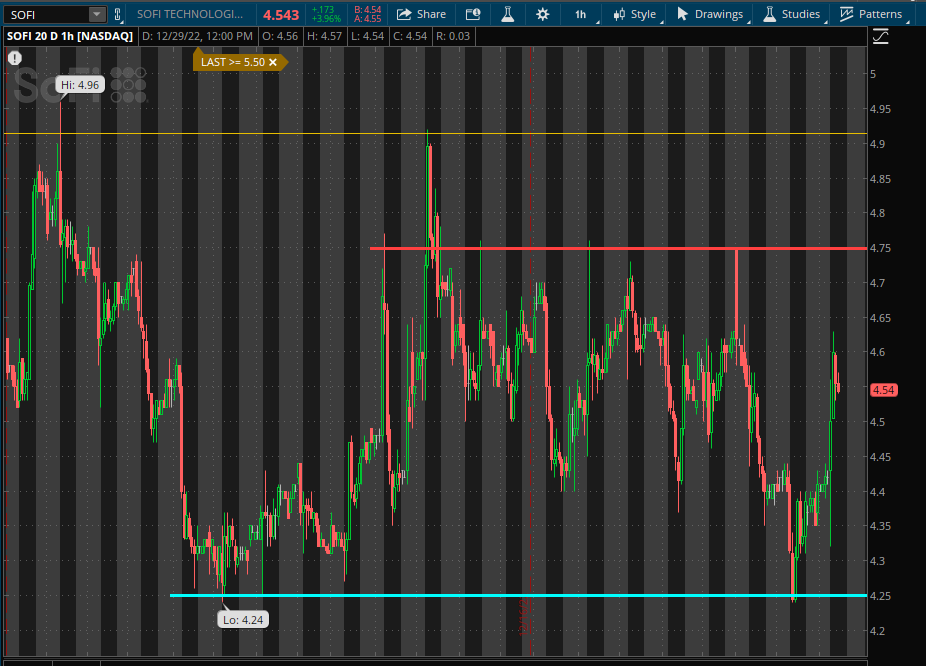
SOFI has identified a resistance level (sell point) at the $4.75 mark (identified by the red line.) The blue line represents a strong support (buy point) at $4.25. Traders that capitalized in this zone would have generated 11% returns in only a few trading days.
In conclusion, support and resistance lines are an important tool for traders, as they can help identify key levels where a stock’s price may struggle to break through or may bounce off of. These levels can be used to make informed trading decisions and potentially maximize profits.
One way for traders to easily find and monitor support and resistance levels is by using TradeUI, a comprehensive trading platform that provides a range of tools and resources for traders of all levels. With TradeUI, traders can access real-time market data, create custom charts with a variety of technical indicators, and set up alerts for when a stock hits a specific price level.
In addition, TradeUI offers a range of educational resources and support for traders, including webinars, guides, and a dedicated customer support team. All of these features can help traders stay informed and make informed trading decisions, using support and resistance lines and other technical indicators to their advantage.
Overall, TradeUI is a valuable resource for traders looking to make the most of their investments and capitalize on market opportunities. By using TradeUI to find and monitor support and resistance levels, traders can potentially increase their chances of success and navigate the ever-changing world of stock trading with confidence. Click the link below to check out TradeUI for yourself and see if its the right fit for you.
Trading Stocks and Options with Options Flow and Market analysis AI tools